The Hidden Cost of Kubernetes: Why Your Cloud Bill Is 40% Higher Than It Should Be
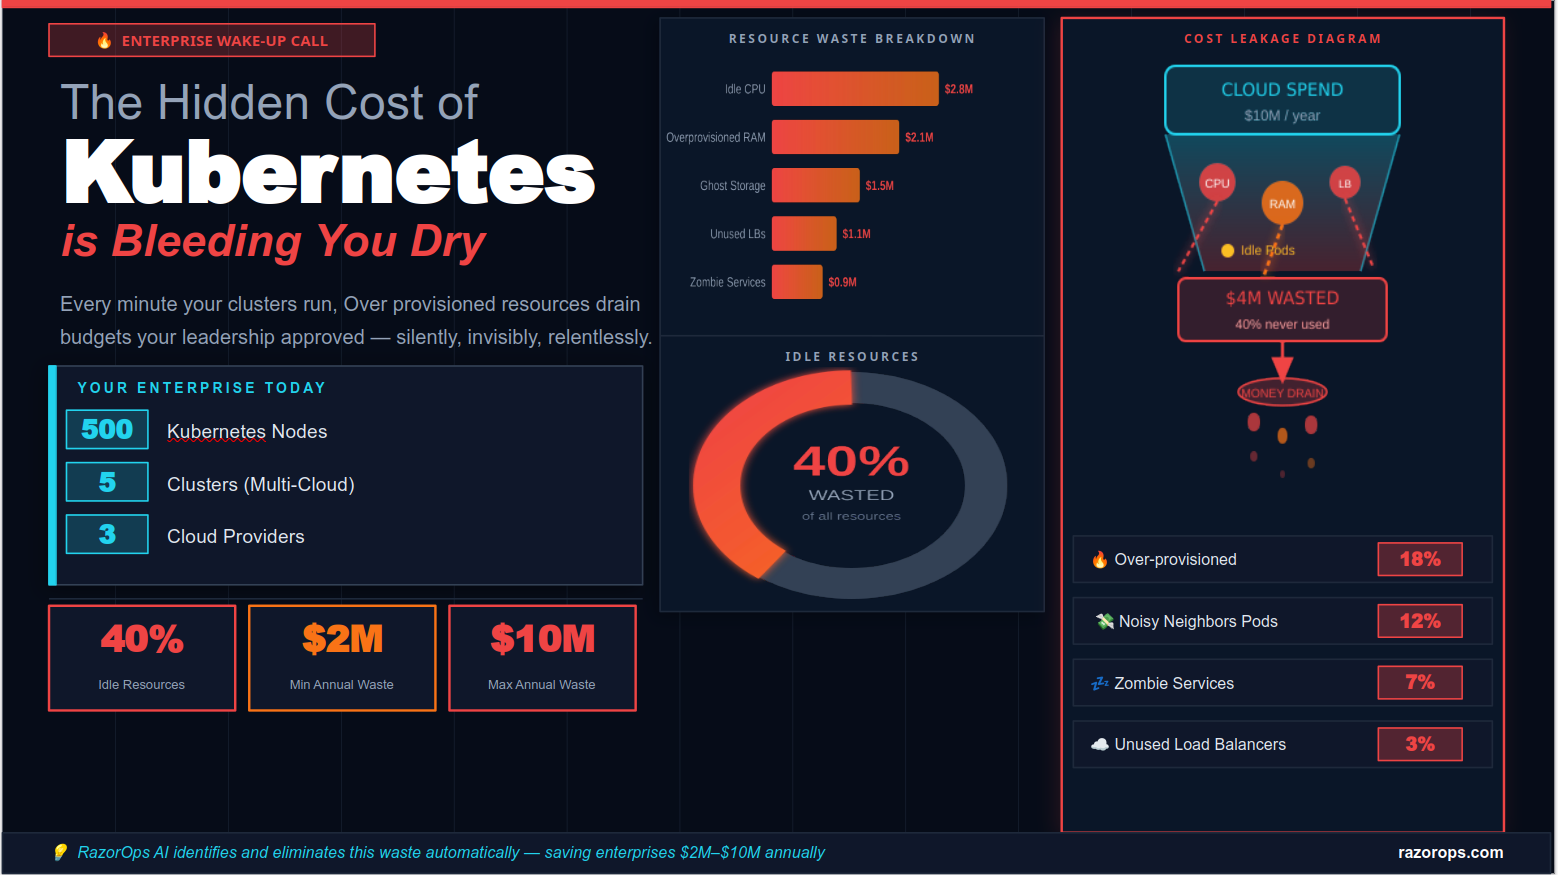
The average enterprise running Kubernetes wastes between $2 million and $10 million annually — not from overspending, but from under-optimizing. This is the story of costs you can't see on your dashboard but that your CFO feels every quarter.
Table of Contents
- The Kubernetes Promise vs. The Kubernetes Reality
- What "Hidden Costs" Actually Means in Kubernetes
- The 7 Major Sources of Kubernetes Waste
- Real Numbers: What 500 Nodes Across 5 Clusters Actually Costs
- The Multi-Cloud Tax Nobody Talks About
- Why Traditional Monitoring Misses the Waste
- The FinOps Gap: Why Engineers and Finance Teams Never Agree
- How AI-Powered Optimization Changes the Equation
- What Good Kubernetes Cost Hygiene Looks Like
- Benchmark: Where Does Your Organization Stand?
- Action Plan: Immediate Steps to Reduce Kubernetes Waste
- Conclusion: The Cost of Inaction
1. The Kubernetes Promise vs. The Kubernetes Reality
When your organization adopted Kubernetes, the pitch was compelling: container orchestration at scale, faster deployments, infrastructure-as-code, and the elastic scalability to grow without proportional cost increases. Kubernetes promised to make cloud-native infrastructure efficient, observable, and manageable.
Three to five years in, most enterprise engineering and finance teams are asking the same uncomfortable question: Why is our cloud bill growing faster than our business?
The answer, almost universally, is hidden Kubernetes waste — a category of cloud spending that lives in the gap between what infrastructure is provisioned and what applications actually consume. It doesn't show up as a line item in your AWS Cost Explorer or Google Cloud Billing dashboard. It accumulates silently, invisibly, and at enterprise scale it compounds into multi-million dollar annual losses.
This is not a niche problem for startups misconfiguring their first cluster. It is the dominant cloud cost challenge for mid-market and enterprise organizations in 2024 and 2025. According to multiple cloud FinOps reports, between 35% and 45% of Kubernetes compute resources sit idle at any given time across typical production environments. For an organization running 500 nodes across 5 clusters in a multi-cloud setup, that translates to somewhere between $2 million and $10 million in pure annual waste — money that was budgeted, approved, and spent, but generated zero business value.
Understanding where that waste comes from is the first step toward eliminating it.
2. What "Hidden Costs" Actually Means in Kubernetes {#what-are-hidden-costs}
The phrase "hidden costs" is often used loosely. In the Kubernetes context, it has a precise meaning: costs that are real and measurable, but invisible to standard monitoring and reporting tools.
Standard cloud cost dashboards show you what you paid. They don't show you what you wasted. There is a critical difference.
Hidden Kubernetes costs fall into three broad categories:
Structural waste — resources that are provisioned by default or by convention but never actually utilized. Over-provisioned CPU and memory requests, node buffer capacity that never gets consumed, persistent volumes attached to terminated pods.
Behavioral waste — resources that are consumed inconsistently due to how teams configure and deploy workloads. Dev and staging environments left running at production scale overnight and over weekends. Load tests that spin up resources and never clean them up. Autoscaling policies configured for peak traffic that never arrives.
Architectural waste — the overhead embedded in design decisions. Microservices architectures that create exponentially more inter-service network traffic. Sidecar containers that duplicate compute for observability without being right-sized. Multi-cluster setups that duplicate control plane costs without proportional efficiency gains.
All three categories are real. All three are preventable. None of them appear on the invoice your cloud provider sends you.
3. The 7 Major Sources of Kubernetes Waste {#7-sources-of-waste}
3.1 Over-Provisioned Resource Requests and Limits
This is the single largest source of Kubernetes waste, responsible for an estimated 30–40% of idle compute in production clusters.
When developers set CPU and memory requests and limits in their pod specifications, they almost always err on the side of caution. A service that uses 200m CPU under normal load gets a 1000m request because nobody wants to be the engineer whose service throttled in production. Multiply this conservatism across hundreds of services and thousands of pods and you have a cluster that is paying for 5x the compute it actually needs.
The Kubernetes scheduler allocates node capacity based on requests, not actual usage. A node can appear "full" to the scheduler while running at 20% actual CPU utilization. This gap between requested capacity and consumed capacity is one of the most expensive silent costs in cloud infrastructure.
Quantified impact: For a 500-node cluster with average 4 vCPU nodes at $0.10/vCPU-hour, 40% idle CPU represents approximately $700,000 in annual wasted compute on CPU alone, before accounting for memory over-provisioning.
3.2 Ghost Pods and Zombie Services
Ghost pods are running containers attached to services that no longer have active users, traffic, or business purpose. Zombie services are microservices that continue to run — consuming compute, memory, and network — despite being deprecated or replaced by newer implementations.
These aren't hypothetical. In organizations that have run Kubernetes for more than two years without systematic cost governance, it is common to find 15–20% of running pods serving zero meaningful traffic. They exist because:
- Teams deploy new versions without removing old ones
- Feature flags disable functionality without stopping the infrastructure
- Experimental services get forgotten after proof-of-concept phases
- Team turnover leaves no one accountable for decommissioning old workloads
Ghost pods and zombie services collectively represent $500K–$2M in annual waste for a 500-node enterprise cluster.
3.3 Idle Development and Staging Environments
This is the hidden cost that most engineering managers know about intellectually but rarely quantify. Development, staging, QA, and integration testing environments are provisioned to mirror production for valid reasons — you want realistic performance testing and accurate environment parity. But these environments are only actively used for a fraction of their operational time.
An environment provisioned at production scale runs 168 hours per week. Engineers actively use it perhaps 40–50 of those hours. The remaining 70–76% of runtime is pure waste — nights, weekends, public holidays, vacation periods.
For organizations running 5 clusters where 2 or 3 are non-production, the arithmetic is sobering. If your production cluster costs $3M annually and your staging and development environments are 60% of production scale, that's $1.8M in non-production spend — of which over $1.3M is burning while nobody is working.
3.4 Misconfigured Autoscaling Policies
Kubernetes offers powerful autoscaling through the Horizontal Pod Autoscaler (HPA), Vertical Pod Autoscaler (VPA), and cluster-level autoscaling via Cluster Autoscaler or Karpenter. When these work correctly, they are transformative for cost efficiency. When misconfigured — which is common — they actively create waste.
Common autoscaling misconfigurations include:
- Minimum replica counts set too high — a service configured with
minReplicas: 10that only needs 2 replicas under normal load - Scale-down delay too conservative — autoscalers configured to wait 30 minutes before scaling down after a traffic spike that lasted 5 minutes
- Threshold triggers too sensitive — HPA policies that scale up at 50% CPU utilization, causing continuous scale-up/scale-down cycles that never reach equilibrium
- VPA recommendations ignored — organizations that have VPA installed in "recommendation only" mode but never act on the recommendations
Misconfigured autoscaling doesn't just waste money in the immediate term — it creates infrastructure behavior patterns that are hard to predict and even harder to budget.
3.5 Orphaned Persistent Storage
Storage is one of the least visible and most persistent sources of Kubernetes waste. Persistent Volume Claims (PVCs) survive pod and namespace deletion by design — Kubernetes protects data by default. The unintended consequence is that organizations accumulate terabytes of orphaned persistent storage: volumes that were provisioned for workloads that no longer exist.
AWS EBS volumes, Google Persistent Disks, and Azure Managed Disks all charge by provisioned capacity, not by actual data stored. A 1TB volume attached to a dead pod costs the same as one actively serving a production database.
In mature Kubernetes environments, orphaned storage commonly represents $200K–$500K in annual unnecessary cloud expenditure — a cost category that many FinOps teams don't even track separately.
3.6 Over-Provisioned Load Balancers and Network Egress
Every Kubernetes service of type LoadBalancer provisions a cloud load balancer — at AWS, a Classic ELB or ALB; at GCP, a Cloud Load Balancer. Each one carries a fixed hourly cost regardless of traffic volume. In microservices architectures with dozens or hundreds of services, teams routinely provision external load balancers for internal services that never receive external traffic.
Combined with network egress costs — data transfer charges for cross-zone, cross-region, and internet-bound traffic — networking overhead commonly adds 10–15% to total Kubernetes infrastructure cost beyond what teams budget for compute.
3.7 Control Plane and Management Overhead in Multi-Cloud Setups
Running Kubernetes across multiple cloud providers — a common enterprise architecture for avoiding vendor lock-in, meeting data residency requirements, or supporting M&A integration — introduces a category of cost that is genuinely invisible until you add it up: management overhead.
Each managed Kubernetes control plane (EKS, GKE, AKS) carries a fixed cost. Tooling to manage cross-cloud observability, networking, identity, and security is duplicated across environments. Engineering time spent on multi-cloud operational complexity is real cost that rarely appears in cloud bills but absolutely appears in payroll.
For a 5-cluster multi-cloud setup, management overhead — control plane costs, duplicated tooling, and engineering time — adds an estimated $300K–$800K annually beyond raw compute costs.
4. Real Numbers: What 500 Nodes Across 5 Clusters Actually Costs {#real-numbers}
Let's make this concrete with a realistic enterprise scenario.
Base Configuration:
- 500 worker nodes (mix of m5.xlarge and m5.2xlarge on AWS, n2-standard-4 on GCP, Standard_D4s_v3 on Azure)
- 5 clusters: 2 production, 1 staging, 1 development, 1 data/analytics
- Average all-in node cost: $0.35/hour including storage, networking, and reserved instance blending
- Annual base infrastructure spend: ~$15.3M
Waste analysis across the 7 categories:
| Waste Category | Estimated Annual Cost | % of Total |
|---|---|---|
| Over-provisioned CPU/memory requests | $2.8M | 18.3% |
| Idle staging/dev environments | $2.1M | 13.7% |
| Ghost pods and zombie services | $1.5M | 9.8% |
| Orphaned persistent storage | $0.9M | 5.9% |
| Misconfigured autoscaling | $0.7M | 4.6% |
| Over-provisioned load balancers | $0.4M | 2.6% |
| Multi-cloud management overhead | $0.6M | 3.9% |
| Total Identified Waste | $9.0M | 58.8% |
Even with conservative estimates, this enterprise is spending close to $9 million per year on infrastructure that delivers no business value. Applying a 30% optimization target — achievable without changing application architectures — would recover $2.7M–$4.5M annually.
5. The Multi-Cloud Tax Nobody Talks About {#multi-cloud-tax}
Multi-cloud strategy is often framed as a risk mitigation and negotiation play. In theory, running workloads across AWS, GCP, and Azure prevents vendor lock-in, allows cost arbitrage between providers, and ensures business continuity.
In practice, multi-cloud Kubernetes deployments carry a hidden tax that erodes most of those theoretical benefits.
Tooling duplication: Each cloud provider's Kubernetes implementation (EKS, GKE, AKS) has different networking models, storage drivers, IAM integrations, and autoscaling mechanisms. Organizations running multi-cloud either build and maintain custom abstractions across these differences (expensive engineering time) or accept divergent operational models (expensive operational complexity and errors).
Observability fragmentation: Metrics, logs, and traces from multi-cloud clusters need to be centralized before they can inform cost decisions. The infrastructure for cross-cloud observability — typically involving tools like Prometheus federation, Thanos, or Grafana Agent with remote write — adds its own compute and engineering cost.
Cross-cloud data transfer costs: If workloads on different clouds communicate — and in integrated enterprise architectures, they often do — egress charges accumulate on both sides of the data flow. AWS charges for data leaving an EC2 instance. GCP charges for data leaving a VM. The same data payload can generate egress fees on both ends.
Security and compliance overhead: Multi-cloud environments require duplicated security policies, IAM configurations, network security groups, and compliance controls. Each cloud provider has different terminology and tooling for what are functionally equivalent controls. Engineering hours spent maintaining security parity across clouds are real costs.
The multi-cloud tax is estimated at 20–35% overhead on top of raw compute costs for organizations that haven't specifically invested in multi-cloud platform engineering capabilities. For an organization spending $15M on multi-cloud Kubernetes infrastructure, that's $3M–$5.25M in overhead beyond what single-cloud deployment would require.
6. Why Traditional Monitoring Misses the Waste {#monitoring-gap}
If all this waste exists, why don't engineering teams see it? The answer lies in how monitoring tools are designed and what questions they're built to answer.
Prometheus and Grafana are built to answer operational questions: Is my service healthy? Is CPU above threshold? Are pods crashing? They are excellent at detecting performance problems. They are not designed to quantify cost waste or attribute spend to business outcomes.
Cloud provider cost dashboards (AWS Cost Explorer, GCP Cost Management, Azure Cost Management) show you aggregate spend by service, by region, by tag. They don't understand the Kubernetes abstraction layer. They can tell you that you spent $500K on EC2 in us-east-1 last month, but they can't tell you that $200K of that was idle compute consumed by over-provisioned pods in your staging namespace.
Kubernetes native tooling like kubectl top shows current resource utilization but not historical patterns, not waste trends, and not cost attribution.
The gap between these tools is exactly where hidden costs live. Closing that gap requires correlating three data streams simultaneously: Kubernetes resource utilization metrics, cloud provider billing data, and business context (which teams own which workloads, which workloads matter to which business outcomes).
7. The FinOps Gap: Why Engineers and Finance Teams Never Agree {#finops-gap}
One of the most underappreciated contributors to Kubernetes waste is organizational rather than technical: the disconnect between engineering teams who make infrastructure decisions and finance teams who are accountable for the resulting costs.
Engineers optimize for reliability and performance. They provision conservatively because over-provisioning never pages at 2am. Finance teams optimize for budget adherence but lack the technical context to challenge specific infrastructure decisions. The result is a dynamic where:
- Engineering teams request infrastructure budgets based on peak capacity requirements
- Finance approves those budgets without visibility into utilization
- Month-end reports show budget adherence (the money was spent as budgeted) even though 40% of what was bought was never used
- Nobody is accountable for the waste because nobody can see it
This is the FinOps gap — and closing it requires shared visibility, shared vocabulary, and shared incentives between engineering and finance. Practices like showback (making teams visible to their own cloud costs) and chargeback (attributing costs to cost centers) are standard FinOps techniques for closing this gap. But they only work when cost data is granular enough to attribute to specific teams, namespaces, and workloads — a level of granularity that requires Kubernetes-aware cost tooling.
8. How AI-Powered Optimization Changes the Equation {#ai-optimization}
The scale and complexity of Kubernetes waste — distributed across thousands of pods, hundreds of services, multiple clusters, and multiple cloud providers — is fundamentally beyond what human analysis can address comprehensively and continuously. This is where AI-powered Kubernetes optimization platforms change the economics.
Predictive right-sizing with machine learning: Rather than relying on engineers to manually analyze resource utilization and adjust requests and limits, ML models continuously observe actual resource consumption patterns across workloads. They learn seasonal patterns, traffic correlations, and workload-specific behaviors to generate right-sizing recommendations with high confidence and quantified savings impact.
Anomaly detection for cost spikes: LSTM-based time series models can detect when cost trajectories deviate from expected patterns before they become expensive surprises. If a new deployment doubles the resource footprint of a service, anomaly detection catches it within hours — not at month-end billing review.
Automated workload scheduling: Reinforcement learning policies can continuously optimize pod placement across nodes to maximize bin-packing efficiency — fitting more workloads onto fewer nodes without impacting performance. Combined with spot instance management that predicts interruption probability, these policies can reduce compute costs by 30–60% for appropriate workloads.
Intelligent autoscaling: AI-powered autoscaling that predicts traffic patterns rather than reacting to current metrics can pre-scale before demand arrives and scale down faster after it subsides — eliminating the waste buffer that reactive autoscaling requires.
Natural language cost intelligence: LLM-powered interfaces that allow engineering and finance teams to ask questions about their infrastructure in plain language — "Which namespaces are driving cost increases this month?" "What would happen to our bill if we right-sized the top 10 over-provisioned deployments?" — democratize cost visibility without requiring FinOps expertise.
Organizations that have deployed AI-powered Kubernetes optimization report cost reductions of 30–60% on addressable waste — translating to millions of dollars in annual savings for enterprise-scale deployments.
9. What Good Kubernetes Cost Hygiene Looks Like {#cost-hygiene}
Beyond AI-powered optimization, there are foundational practices that every Kubernetes organization should have in place. These are the basics — not sufficient alone to eliminate waste at scale, but necessary preconditions for effective cost management.
Mandatory resource requests and limits: Every deployment should specify CPU and memory requests and limits. Enforce this with admission controllers (OPA Gatekeeper or Kyverno policies) that reject deployments without resource specifications. This eliminates the worst cases of unbounded resource consumption.
Namespace-level cost attribution: Establish a namespace structure that maps to business units, teams, or products. Apply consistent labels to all workloads. This creates the foundation for showback and chargeback reporting.
Regular resource utilization reviews: Schedule monthly or quarterly reviews of actual versus requested resource utilization by namespace and by service. Use VPA recommendations as a starting point for right-sizing conversations.
Non-production environment scheduling: Implement automated shutdown schedules for development and staging environments outside of business hours and on weekends. Tools like Kube-Downscaler or custom CronJob-based scaling can reduce non-production costs by 60–70%.
Storage lifecycle policies: Implement policies that automatically flag or delete PVCs that have been unattached for more than 7 or 14 days. Add retention policies to backup snapshots. Storage hygiene alone can recover hundreds of thousands of dollars annually.
Cost budgets and alerts: Set namespace-level and cluster-level cost budgets with automated alerts when spending approaches thresholds. Make cost visibility part of the standard CI/CD pipeline — surface projected cost changes as part of deployment review.
10. Benchmark: Where Does Your Organization Stand? {#benchmark}
Use these benchmarks to assess your current Kubernetes cost efficiency:
| Metric | Best Practice | Industry Average | Warning Zone |
|---|---|---|---|
| CPU utilization (actual vs. requested) | >65% | 30–45% | <25% |
| Memory utilization (actual vs. requested) | >70% | 35–50% | <25% |
| Non-production hours utilization | >60% | 30–40% | <20% |
| % of pods with resource requests set | 100% | 60–75% | <50% |
| Cost attribution coverage (labeled workloads) | >95% | 50–70% | <40% |
| Orphaned PVC rate | <2% | 10–20% | >25% |
| Cost per customer / cost per transaction visibility | Full | Partial | None |
If your organization scores in the "Warning Zone" on three or more of these metrics, you are almost certainly in the $2M–$10M annual waste range for an enterprise-scale deployment.
11. Action Plan: Immediate Steps to Reduce Kubernetes Waste {#action-plan}
Here is a prioritized 90-day action plan for organizations ready to address Kubernetes hidden costs:
Days 1–30: Visibility First
You cannot optimize what you cannot see. The first priority is establishing cost visibility at the namespace and workload level.
- Deploy a Kubernetes cost monitoring tool (OpenCost, Kubecost, or a commercial platform like RazorOps) that correlates Kubernetes resource usage with cloud provider billing data
- Audit your namespace structure and label coverage — at minimum, every workload should have
team,environment, andservicelabels - Generate your first cost attribution report by team and by environment
- Identify your top 20 highest-cost namespaces and your top 20 most over-provisioned deployments
Days 31–60: Quick Wins
With visibility established, attack the highest-impact, lowest-risk optimizations first.
- Implement automated scheduling to shut down development and staging environments outside business hours — target 60–70% reduction in non-production runtime
- Right-size the 20 most over-provisioned deployments identified in phase one — use VPA recommendations as a starting point, validate in staging first
- Audit and delete orphaned PVCs and unused load balancers
- Review and rationalize minimum replica counts across your deployments
Days 61–90: Systematic Optimization
- Implement resource request and limit policies via admission controller across all namespaces
- Set up cost budgets and automated alerts by team/namespace
- Begin evaluating spot and preemptible instance strategies for batch, data processing, and stateless workloads
- Establish a monthly FinOps review cadence with engineering leads and finance representatives
- Evaluate AI-powered optimization tooling for continuous right-sizing and autoscaling optimization
90-day expected outcomes: Organizations that execute this plan consistently report 20–35% cost reduction within the first quarter, with further optimization continuing over the following 6–12 months as ML models accumulate historical data for better recommendations.
12. Conclusion: The Cost of Inaction {#conclusion}
The hidden costs of Kubernetes are not a future risk. They are a present reality, accumulating every hour your clusters run with idle CPUs, oversized memory allocations, zombie services, and unattended storage volumes.
For an enterprise running 500 nodes across 5 clusters in a multi-cloud setup, the mathematics are unambiguous: between $2 million and $10 million is being spent annually on infrastructure that creates no business value. That money has already been approved, budgeted, and spent. The only question is whether next year's budget will look the same.
The good news is that this is a solvable problem. The tools exist, the methodologies are proven, and the ROI is among the clearest in enterprise technology investment — FinOps and Kubernetes cost optimization typically deliver 10x or greater return on tooling and implementation investment within the first year.
What makes Kubernetes cost optimization different from general cloud cost management is the complexity and velocity of the environment. Kubernetes clusters change continuously — new deployments, scaling events, pod scheduling decisions — in ways that manual analysis cannot track. AI-powered platforms that continuously observe, learn, and recommend changes at the speed of the environment are no longer a luxury for enterprise deployments. They are the infrastructure layer that makes the economics of container orchestration actually work as promised.
The hidden cost of Kubernetes is the cost of not optimizing it. At enterprise scale, that cost has a very precise range: $2 million to $10 million per year. The question isn't whether your organization is paying it. The question is how much longer you're willing to.
Key Takeaways
- 40% of Kubernetes resources sit idle in typical enterprise production environments
- Enterprise deployments of 500 nodes across 5 clusters waste $2M–$10M annually through hidden inefficiencies
- The 7 major waste categories are: over-provisioned requests, ghost pods, idle non-production environments, misconfigured autoscaling, orphaned storage, over-provisioned load balancers, and multi-cloud management overhead
- Standard monitoring tools (Prometheus, cloud dashboards) cannot see this waste because they weren't designed to
- The FinOps gap — disconnect between engineering and finance — perpetuates waste organizationally
- AI-powered optimization platforms deliver 30–60% reduction in addressable waste by continuously right-sizing, scheduling, and automating cost governance
- A 90-day action plan starting with visibility, then quick wins, then systematic optimization delivers measurable ROI within one quarter
Frequently Asked Questions
Q: What is the average Kubernetes resource utilization rate in enterprise environments? Most enterprise Kubernetes clusters run at 30–45% actual CPU utilization relative to requested capacity. Best-in-class organizations achieve 65%+ utilization through active right-sizing and autoscaling optimization.
Q: How does Kubernetes cost optimization differ from general cloud cost management? General cloud cost management tools work at the level of cloud provider resources (EC2 instances, VMs, storage volumes). Kubernetes cost optimization requires understanding the abstraction layer above that — namespaces, pods, deployments, and services — and correlating Kubernetes metrics with cloud billing data. Kubernetes-aware tooling is required.
Q: What is the ROI on Kubernetes cost optimization tooling? For enterprise-scale deployments, purpose-built Kubernetes cost optimization tools (including AI-powered platforms like RazorOps) typically deliver 10x or greater ROI within the first 12 months, based on recovered waste minus tooling and implementation costs.
Q: Can we reduce Kubernetes costs without changing application architectures? Yes. Right-sizing resource requests and limits, implementing non-production environment scheduling, cleaning up orphaned resources, and optimizing autoscaling policies are all infrastructure-level changes that don't require application code changes. These alone typically deliver 20–40% cost reduction.
Q: What is Kubernetes FinOps? Kubernetes FinOps is the practice of applying financial accountability principles to Kubernetes infrastructure management. It encompasses cost attribution (connecting infrastructure spend to teams, products, and business outcomes), cost governance (policies and processes to control waste), and continuous optimization (using data and automation to improve cost efficiency over time).
RazorOps is an AI-powered Kubernetes cost optimization platform that helps enterprises identify and eliminate infrastructure waste across multi-cloud Kubernetes environments. Organizations using RazorOps report average cost reductions of 30–60% within 90 days of deployment.
Tags: Kubernetes cost optimization, hidden cloud costs, FinOps, Kubernetes waste, cloud infrastructure costs, container cost management, multi-cloud cost management, Kubernetes FinOps, AI infrastructure optimization, cloud cost reduction, EKS cost optimization, GKE cost management, AKS cost optimization, Kubernetes resource management, cloud FinOps 2025
Enjoyed this article? Share it.